Week 9: Functions, loops
PUBPOL 750 Data Analysis for Public Policy I
Justin Savoie
MPP-DS McMaster
2022-07-15
Becoming more efficient: functions and loop
Becoming more efficient with functions and loop
- Automate common tasks
- Apply the same "procedure" to tens or hundreds of files, of objects, of dataframes, of variables.
- In a nutshell:
- Functions allow to avoid copy pasting, allow to reuse a procedure
- Loops allow to do one thing many times
- They are often used in combination.
Functions (justyfying their use)
set.seed(232)df <- tibble::tibble( a = rnorm(10), b = rnorm(10), c = rnorm(10))df$a <- (df$a - min(df$a, na.rm = TRUE)) / (max(df$a, na.rm = TRUE) - min(df$a, na.rm = TRUE))df$b <- (df$b - min(df$b, na.rm = TRUE)) / (max(df$b, na.rm = TRUE) - min(df$b, na.rm = TRUE))df$c <- (df$c - min(df$c, na.rm = TRUE)) / (max(df$c, na.rm = TRUE) - min(df$c, na.rm = TRUE))head(df)## # A tibble: 6 × 3## a b c## <dbl> <dbl> <dbl>## 1 1 0.277 0.667## 2 0 0.375 0 ## 3 0.553 0.634 0.478## 4 0.499 1 0.562## 5 0.423 0.914 0.629## 6 0.589 0.802 0.557set.seed(232)df <- tibble::tibble( a = rnorm(10), b = rnorm(10), c = rnorm(10))rescale01 <- function(x) { rng <- range(x, na.rm = TRUE) (x - rng[1]) / (rng[2] - rng[1])}df$a <- rescale01(df$a)df$b <- rescale01(df$b)df$c <- rescale01(df$c)head(df)## # A tibble: 6 × 3## a b c## <dbl> <dbl> <dbl>## 1 1 0.277 0.667## 2 0 0.375 0 ## 3 0.553 0.634 0.478## 4 0.499 1 0.562## 5 0.423 0.914 0.629## 6 0.589 0.802 0.557Implementing the mean function by taking the sum, and dividing by the number of non missing cases.
my_vector <- c(3,8,19,NA,22,1)mean(my_vector,na.rm=TRUE)## [1] 10.6custom_mean1 <- function(x){ my_sum <- sum(x,na.rm=TRUE) my_length <- sum(!is.na(x)) my_sum / my_length}custom_mean1(my_vector)## [1] 10.6Implementing the same mean function by going through all values one by one and calculating a bit like we would do in elementary school. This is often the logic in real functions. Breaking down everything.
custom_mean2 <- function(x){ my_length <- 0 my_sum <- 0 for (i in my_vector){ if (!is.na(i)){ my_length <- my_length + 1 my_sum <- my_sum + i } } my_sum / my_length}custom_mean2(my_vector)## [1] 10.6Using existing functions
Of course, you likely won't have to write many functions. A lot of functions exists. We've been using functions since the beginning of the semester.
mean() group_by() ggplot() (and many more) these are all functions.
Functions are incredibly useful.
You might, for example, want to:
- Calculate cross tabs and plot them, for many survey questions (à la what polling firms)
- Read in a court decision and clean it to a format you can analyze
Example
Imagine we have 200 respondents on 10 questions. Answers: {1:"Strongly disagree",2:"Somewhat disagree",3:"Neutral",4:"Somewhat agree",5:"Strongly agree",6:"Don't know"}. We want to plot the responses to each question in a separate figure.
questions <- paste0("question",1:10)df <- as_tibble(matrix(sample(1:6,size=2000,replace = TRUE),nrow=200))names(df) <- questionsdf## # A tibble: 200 × 10## question1 question2 question3 question4 question5 question6 question7## <int> <int> <int> <int> <int> <int> <int>## 1 5 6 1 3 3 3 6## 2 6 3 1 1 3 4 6## 3 3 5 5 5 4 6 5## 4 3 1 2 6 3 2 5## 5 1 2 6 4 5 5 6## 6 3 3 5 5 5 3 1## 7 6 5 6 3 6 1 1## 8 5 3 3 3 5 2 4## 9 1 5 5 2 4 3 1## 10 3 6 1 4 2 3 1## # … with 190 more rows, and 3 more variables: question8 <int>, question9 <int>,## # question10 <int>make_plot <- function(data,my_variable,answer_choices){ to_plot <- data %>% select(all_of(my_variable)) %>% rename(selected_variable=all_of(my_variable)) %>% group_by(selected_variable) %>% count() %>% ungroup() %>% mutate(p=n/sum(n)) to_plot <- to_plot %>% mutate(selected_variable=recode(selected_variable,!!!answer_choices)) %>% mutate(selected_variable = factor(selected_variable,answer_choices)) ggplot(to_plot,aes(x=selected_variable,y=p)) + geom_bar(stat='identity') + geom_text(aes(label = p), vjust = 1.5, colour = "white")}answer_choices=c("Strongly disagree","Somewhat disagree","Neutral",'Somewhat agree',"Strongly agree","Don't know")make_plot(data=df,my_variable='question1',answer_choices=answer_choices)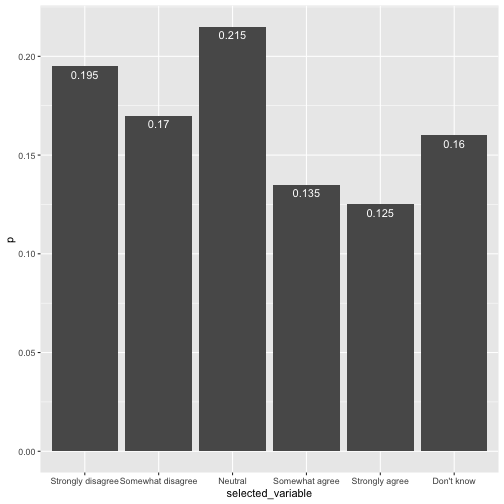
make_plot(data=df,my_variable='question2',answer_choices)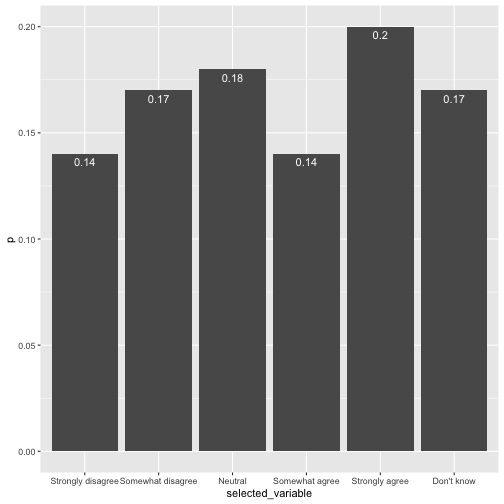
make_data_to_plot <- function(data,my_variable){ to_plot <- data %>% select(all_of(my_variable)) %>% rename(selected_variable=all_of(my_variable)) %>% group_by(selected_variable) %>% count() %>% ungroup() %>% mutate(p=n/sum(n)) to_plot <- to_plot %>% mutate(selected_variable=recode(selected_variable,!!!answer_choices)) %>% mutate(selected_variable = factor(selected_variable,answer_choices)) to_plot}make_plot <- function(data,answer_choices){ ggplot(data,aes(x=selected_variable,y=p)) + geom_bar(stat='identity') + geom_text(aes(label = p), vjust = 1.5, colour = "white")}data_to_plot <- make_data_to_plot(data=df,my_variable='question2')make_plot(data_to_plot,answer_choices)
Loops (Iteration chapter in the book)
threeletters <- c("a","b","c")for (i in threeletters){ print(i)}## [1] "a"## [1] "b"## [1] "c"for (i in seq_along(threeletters)){ print(i) print(threeletters[i])}## [1] 1## [1] "a"## [1] 2## [1] "b"## [1] 3## [1] "c"df <- tibble( a = rnorm(10), b = rnorm(10), c = rnorm(10), d = rnorm(10))output <- vector("double", ncol(df))for (i in seq_along(df)) { output[[i]] <- median(df[[i]]) }output## [1] 0.333332638 0.758161632 -0.002268765 -0.107977257for (i in seq_along(df)) { df[[i]] <- df[[i]]+10 }df## # A tibble: 10 × 4## a b c d## <dbl> <dbl> <dbl> <dbl>## 1 10.9 10.6 9.47 10.8 ## 2 9.40 8.26 9.08 11.1 ## 3 10.3 11.0 11.0 8.72## 4 11.5 11.7 12.0 10.2 ## 5 11.1 11.6 10.1 10.7 ## 6 10.2 11.1 10.3 9.57## 7 9.23 10.4 9.93 9.02## 8 9.88 11.3 9.56 11.2 ## 9 10.3 10.3 12.0 8.24## 10 11.9 9.85 8.42 7.94